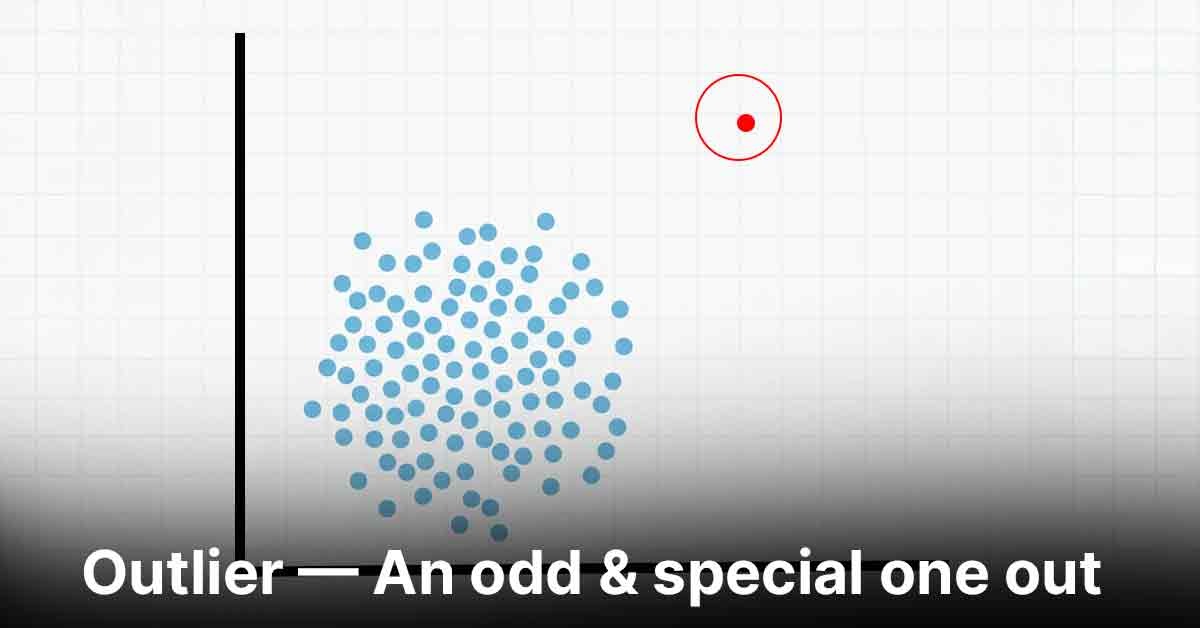
“An extreme values that stand out greatly from overall pattern of values”
Press enter or click to view image in full size

It is interesting to see the translations of “outlier” — according to its context — in English:
- Atypical
- Featured
- Exceptional
- Abnormal
- Extreme Value, Abnormal Value, Aberrant Value!
That gives us an idea, doesn’t it?

According to Wikipedia, the outliers in our dataset will be the values that “escape the range where most samples are concentrated” or the samples that are distant from other observations
1. What are Outliers? 🤔 — Lets go by books
We all have heard of the idiom‘odd one out’ which means something unusual in comparison to the others in a group.

Similarly, an Outlier is an observation in a given dataset that lies far from the rest of the observations.

2. Why do they occur?
An outlier may occur due to the variability in the data, or due to experimental error/human error.

Or may be human error, we all do mistakes 😂

Example can be, when transcribing data from paper forms, a temperature of 35°C is mistakenly written as 350°C. This extreme value will appear as an outlier in a dataset of human body temperatures.
or any stupid reason I can think can be — Decimal Point Misplacement:
During data entry, the value 1.234 is mistakenly entered as 1234. This creates a significant outlier in the dataset, especially if the other values are within a similar range around 1.
3. What do they affect?
In statistics, we have three measures of central tendency namely Mean, Median, and Mode. They help us describe the data.
Mean is the accurate measure to describe the data when we do not have any outliers present.
Median is used if there is an outlier in the dataset.
‘Mean’ is the only measure of central tendency that is affected by the outliers which in turn impacts Standard deviation.
Example:
Consider a small dataset, sample= [15, 101, 18, 7, 13, 16, 11, 21, 5, 15, 10, 9]. By looking at it, one can quickly say ‘101’ is an outlier which is much larger than the other values.

If you are interested in another example:- Read this blog:- Mean — The Average, my best guess of all time !!
Standard Deviation:
Outliers affect the standard deviation, a measure of the spread of data. The presence of outliers increases variability, leading to a larger standard deviation.
- High Standard Deviation indicates that the data points are spread out over a wide range of values.
- Low Standard Deviation suggests that the data points are close to the mean.

Example: Daily Stock Returns

Let’s consider a dataset of daily stock returns for a particular stock over 10 days:
- Dataset (in percentage): 1%, 1.2%, 0.8%, 1.1%, 1.3%, 1.2%, 1%, 1.1%, 0.9%, 10%
Here, the first nine values represent typical daily returns, fluctuating slightly around the mean. However, the last value (10%) is an outlier, representing a sudden, drastic change in stock value due to an unusual event (e.g., a major news announcement).
Effect on Standard Deviation:
- Without the Outlier: The standard deviation would be calculated based on the first nine values, which are close to each other and to the mean. This results in a relatively low standard deviation, reflecting low volatility in the stock’s daily returns.
- With the Outlier: When the outlier (10%) is included in the dataset, it dramatically increases the squared differences from the mean. This increases the variance, and consequently, the standard deviation.
- Before Outlier: Suppose the standard deviation without the outlier is 0.15%.
- After Outlier: With the 10% outlier, the standard deviation might increase to 2%, indicating much higher variability.
In nutshell, Most parametric statistics, like means, standard deviations, and correlations, and every statistic based on these, are highly sensitive to outliers.
And since the assumptions of common statistical procedures, like linear regression and ANOVA, are also based on these statistics, outliers can really mess up your analysis.

General Rule:-
- Not all outliers are bad and some should not be deleted. In fact, outliers can be very informative about the subject-area and data collection process. It’s important to understand how outliers occur and whether they might happen again as a normal part of the process or study area ??
Let me proof with an example: Suppose you work in Credit & Fraud Risk controllership department in bank & you want to detect the Fraud translation’s done overseas.
Press enter or click to view image in full size

Now, you plot the Average transaction amounts & found 2 transactions stand out with different patterns.

Now, ask Yourself, will you discard them 🙈
Despite all this, as much as you’d like to, it is NOT acceptable to drop an observation just because it is an outlier. They can be legitimate observations and are sometimes the most interesting ones. It’s important to investigate the nature of the outlier before deciding 🙋
Secondly, Natural Variation can also produce outliers
If your sample size is large enough, you’re bound to obtain unusual values. In a normal distribution, approximately 1 in 340 observations will be at least three standard deviations (3 SDs) away from the mean. However, random chance might include extreme values in smaller datasets. In other words, the process or population you’re studying might produce weird values naturally. There’s nothing wrong with these data points. They’re unusual, but they are a normal part of the data distribution.
If the extreme value is a legitimate observation that is a natural part of the population you’re studying, you should leave it in the dataset.
So, in summary, if the outlier in question is:
- A measurement error or data entry error, correct the error if possible. If you can’t fix it, remove that observation because you know it’s incorrect.
- Not a part of the population you are studying (i.e., unusual properties or conditions), you can legitimately remove the outlier.
- A natural part of the population you are studying, you should not remove it.
In conclusion, It depends on problem Statement When you decide to remove outliers, document the excluded data points and explain your reasoning. You must be able to attribute a specific cause for removing outliers.

Different Outlier Detection Methods in Statistics

I know we are half way done but Good things come in small packages, read next for Detection & Remedies to Outliers.

Till the Time Enjoy the weather & Coffee 😁 and remember everything is going to be normally distributed in the end..
Mastering Statistics alone won’t make you a good Data Scientist. Mastering communication and business sense will. People don’t trust data, they trust the person delivering the insight. — By Tarun Sachdeva


