Let’s draw inferences about the population data from sample data.

Introduction:
Many a times, we can only afford to collect data from samples, because it is too difficult or expensive to acquire data from the whole population that we are interested in.
While using descriptive statistics can only summarize a sample’s characteristics, but inferential statistics use our sample to make reasonable guesses about the larger population. This is called inference making and so it is popular by the name inferential statistics. While using inferential statistics, it’s important to use random and unbiased sampling methods.

Note:- If our sample isn’t representative of your population, then we can’t build right inference on the population.
That’s the complete game of Stats, Make a Guess on Sample and Make Predictions or Inferences about Population.
Its all about choosing the unbiased or best sample or small slice or chunk from population which best describes or the best representative of my whole population.
HEY, WAIT I AM NEW TO DATASCIENCE, I DON’T KNOW ANYTHING ABOUT SAMPLE & POPULATION 😩
Population & Sample

Population : The Population is the Entire group that we are taking for analysis or prediction.
For instance, a population might be the set of:
- All students at a university
- All the cell phones ever manufactured by a company
- All the forests on Earth
Sample : Sample is the Subset of the Population (i.e. Taking random samples from the population). The size of the sample is always less than the total size of the population.
A sample is a subset of a population.
Samples drawn from the above populations might be:
- The math majors at the university
- The cell phones manufactured by the company in the last week
- The forests in Canada
Data professionals use samples to make inferences about populations. In other words, they use the data they collect from a small part of the population to draw conclusions about the population as a whole.

or may be..

Hakuna Matata Time:-

Let’s breakdown in simpler terms:-
Now, assume you are cooking a meal for your party and we all as humans taste the meal before we serve to our guests.
Agree so far..
Although I never do because I am not good in cooking at all. 😂
Scenario:
Imagine you are preparing a large pot of soup for a dinner party. Before serving, you taste a spoonful of the soup to determine if it is salty or tasty, we then assume that the entire pot of soup is salty or tasty based on that small sample.
That’s the key Idea of one point estimate or Inferential Statsitics
Step-by-Step Process:
1.Define the Population and Sample:
- Population: The entire pot of soup.
- Sample: The spoonful of soup you tasted.
2. Collect Data:
- You taste a spoonful of soup and assess its flavor.
3. Assumption and Inference:
- Based on the taste of the spoonful (sample), you make an inference about the taste of the entire pot of soup (population).Assuming the entire pot has a similar taste based on the sample.
4. Inferential Statistics in Action:
- Sample Mean (x̄): The taste quality you experience from the spoonful. Let’s say you rate it as “tasty.”
- Population Mean (μ): The inferred taste quality of the entire pot of soup. You assume it is also “tasty” based on your sample.
Importance of Inferential Statistics in Cooking:
Practicality:
It is impractical to taste the entire pot of soup. Tasting a small sample is a practical way to make a reasonable assumption about the whole dish.
Efficiency:
Tasting just a spoonful saves time and ensures the dish remains intact for serving.
Decision Making:
Based on the taste of the sample, you decide whether any adjustments are needed, such as adding more salt or seasoning.
Summary:
- This method is practical and efficient, allowing you to make informed decisions about the dish without having to taste the whole pot. It demonstrates how inferential statistics can be applied to everyday tasks, helping in decision-making processes based on samples rather than the entire population.
WAIT,
How will you decide that, the spoon you took from complete bowl is a best representative of your dish. May be you took a sample from the middle of bowl where salt content is less or may be you tasted from side of the bowls where salt content is still not well cooked.
Your Guess can be biased.
Well these problems are addressed by different sampling methods. We will discuss these in briefs, for now you can focus on second example.
Example: Election polls or Exit Polls
Imagine you’re a data professional working in a country with a large population like India, Indonesia, the United States, or Brazil. There is an upcoming national election for president. You want to conduct an election poll to see which candidate voters prefer.

Let’s say the population of eligible voters is 100 million people. To survey 100 million people on their voting preferences would take an enormous amount of time, money, and resources — even assuming it would be possible to locate and contact all voters, and that all voters would be willing to participate.
However, it is realistic to survey a sample of 100 or 1000 voters drawn from the larger population of all voters. When you’re dealing with a large population, sampling can help you make valid inferences about the population as a whole.
Representative sample — Be carefull as discussed.
To make valid inferences or accurate predictions about a population, your sample should be representative of the population as a whole. Recall that a representative sample accurately reflects the characteristics of a population. The inferences and predictions you make about your population are based on your sample data.
Ideally, the sample for your election poll will accurately reflect the characteristics of the overall voter population. A voter population in a large country will be diverse in political perspectives, geographic location, age, gender, race, education level, socioeconomic status, etc. Your sample will not be representative if you only collect data from people who belong to certain groups and not others.
For example, if you survey people from one political party, or who have advanced degrees, or are older than 70. The results of an election poll based on a non-representative sample will not be accurate. In general, any claims or inferences you make about any population will have more validity if they are based on a representative sample.
If your sample doesn’t accurately reflect your population, then your inferences will not be reliable, and your predictions will not be accurate.
Well that’s what happened in 2024 Indian Election results.
Statistical methods such as probability sampling help ensure our sample is representative by collecting random samples from the various groups within a population. These methods help reduce sampling bias and increase the validity of your results.
We will discuss the type of sampling in brief in later sections but for now just grasp the overview.
Types of sampling
There are two categories of sampling generally used — probability sampling and non-probability sampling:
- Probability sampling, also known as random sampling, is a kind of sample selection where randomization is used instead of deliberate choice. ( Random Sampling )
- Non-probability sampling techniques involve the researcher deliberately picking items or individuals for the sample based on their research goals or knowledge. ( Deliberate Sampling )

Finally, Lets discuss the Statistical Interference in technical terms, and I promise you will get the definition in one read know.
Statistical inference or Inferential Statistics is the process of drawing conclusions about populations or scientific truths from Sample or slice of data. It allows us to generalise findings from a smaller group (sample) to a larger group (population) while accounting for variability and uncertainty.
Inferential statistics involves using statistical tests, such as hypothesis tests and regression analysis, to determine whether there is a significant relationship or difference between the variables in the sample data and to make predictions about the population based on the sample data.

Types of Tests performed in Inferential statistics.
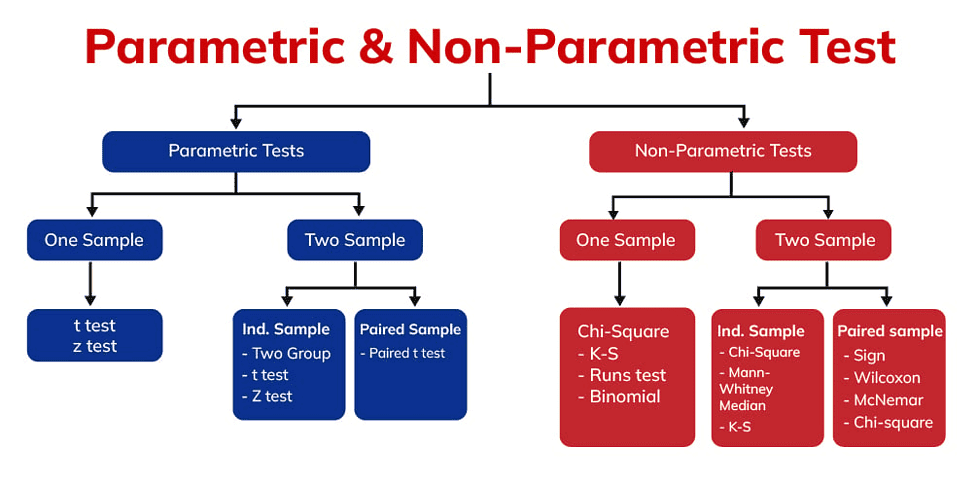
Parametric Tests
Parametric tests assume that the data follows a specific probability distribution, most commonly the normal distribution. If the data are normally distributed, parametric tests such as the t-test, ANOVA or Pearson correlation are used. In this situation, the true distribution of the random variables is not known, or the sample is simply too small to assume a normal distribution.To assume a normal distribution, the sample should at least be larger than 30 cases.

Common examples of parametric algorithms include linear regression and logistic regression.
Non- Parametric Tests
Non-Parametric tests does not assume any particular distribution simply if the data are not normally distributed, the nonparametric tests are used. These are for example the Chi-Square test, Kruskal-Wallis-Test and Wilcoxon test.etc
Common examples of parametric algorithms include Random Forests, Decision tress, KNN.
More Precisely,

Thus, non-parametric tests are more robust than parametric tests and can be calculated in significantly more situations. Parametric tests, however, have a greater statistical power than the non-parametric tests. Therefore, if the assumptions for a parametric test are met, it should always be used.
Its that simple,

Hypothesis Testing — Overview
Hypothesis testing is a statistical technique used to determine whether a population hypothesis is true or false based on a sample of data.
In simple words, Is my interferences or assumptions or guesses which I made fror my population after analysing the sample data is correct or wrong ?

Formulating Hypotheses in Inferential Statistics
A hypothesis is a statement or an educated guess about a population parameter based on sample data. It serves as the foundation for most inferential statistical tests. Let’s break down the key components of hypotheses:
1. Null Hypothesis (H0): The null hypothesis represents the default or status quo assumption. It suggests that there is no significant difference or effect in the population. In other words, any observed differences in the sample are due to random chance.
Example: In a clinical trial, the null hypothesis might state that a new drug has no effect on patient recovery rates.
2. Alternative Hypothesis (Ha or H1): The alternative hypothesis contradicts the null hypothesis. It proposes that there is a significant difference or effect in the population, distinct from random chance.Its always opposite of null and challenges the current status.
Hakuna Matata Trick
This is most confusing concept for many to formulate, how to decide the Null or how to formulate the both hypothesis but my friend Akhil Ajith, a super cool guy in finance told me — What ever you want to proof just keep that on Alternative and eventually opposite to this is Null Hypothesis. Also the reason this is sometimes referred as Research hypothesis as well as researchers who are keen to prove their results are always keen interested in this Alternative hypothesis.
Example: The alternative hypothesis in the clinical trial scenario might state that the new drug leads to a significant improvement in patient recovery rates.
Last concept of Maths Notations:-
Parameter & Statistics
Strictly speaking, Parameters describe populations, while statistics describe samples.
Parameters — Descriptor of population data
A parameter is a numerical value that describes some characteristic of a population. It is a fixed value that is used to describe a population as a whole or characteristic of a population.
Calculating Mean, Variance and Standard Deviation on Population Data known to be a Population parameters.
The population mean and population standard deviation are represented by the Greek letters µ and σ respectively.
Statistics — Descriptor of sample data
A statistic, on the other hand, is a numerical value that describes some characteristic of a sample. It is a calculated value that is used to describe a sample drawn from a population. They are not necessarily the same values as the population parameters.
Calculating Mean(x̅), Variance and Standard Deviation on Sample Data known to be a Sample statistic. A statistic is a characteristic of a sample.
For example, if you have a population of 100 people, and you take a sample of 10 people from that population, the mean and standard deviation of the sample are statistics. They are calculated values that describe the sample, but they are not necessarily the same as the mean and standard deviation of the population as a whole. ( It’s an Ideal situation although 😂 )
For your information, if you are with me so far, the efforts of all statisticians and techniques used is all about bringing sample parameters as close as possible to population parameters. — This is the key Idea.
Here is a table describing both population parameters and sample statistics and their relevant symbols. Note that population parameter symbols are generally Greek letters.

Also, but mostly we are always interested in Mean, Variance and SD.

In nutshell,

That’s all. Easy Peasy ✌️