Author name: Tarun Sachdeva

With over 9 years of experience in data analytics and business intelligence, Tarun has held diverse roles across industries and currently work as a Senior Data Analyst at Beautyplaza, Belgium, where he focuses on delivering actionable insights to optimize business strategies. Previously, Tarun has worked with American Express, and contributed to automation projects, process optimization, and dashboard development using tools like SQL, Tableau, Alteryx, Python, and Machine Learning. Tarun’s expertise lies in enhancing risk control for credit and fraud, supporting compliance, and providing data visualization for critical decision-making. Tarun holds MSc in Data Science & AI from EDHEC Business School and committed to staying at the forefront of this evolving field. He is passionate about sharing knowledge through trainings.

Avatar photo

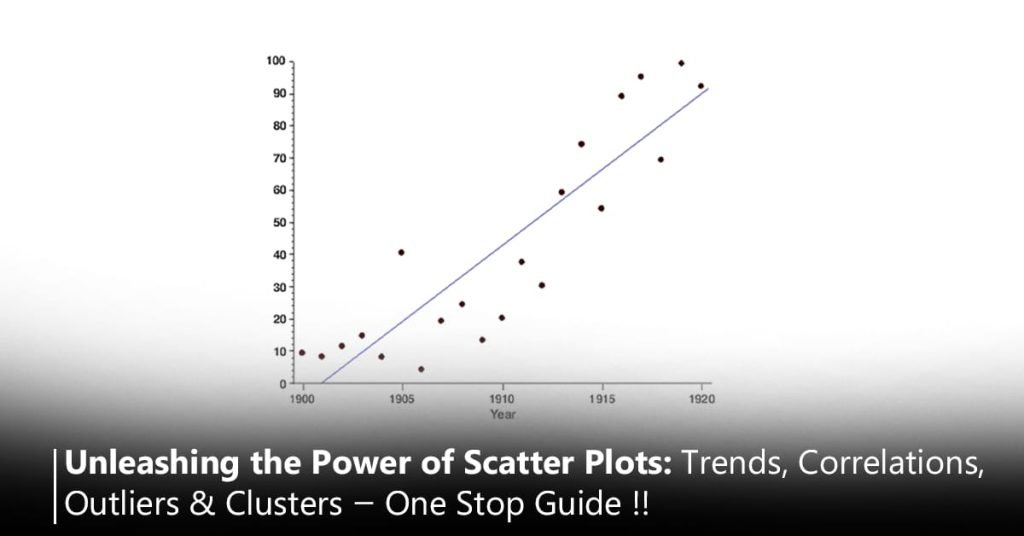
Unleashing the Power of Scatter Plots: Trends, Correlations, Outliers & Clusters — One Stop Guide !!

HISTORY The scatter plot was first used in the early 19th century by John Herschel, an English astronomer and mathematician, in the 1830s. John Herschel, an early user of the scatter plot, applied it to visualize and analyze astronomical data. His interest was in understanding relationships between different celestial observations. However, it was only in the early 20th century that the scatter […]

Unleashing the Power of Scatter Plots: Trends, Correlations, Outliers & Clusters — One Stop Guide !! Read More »

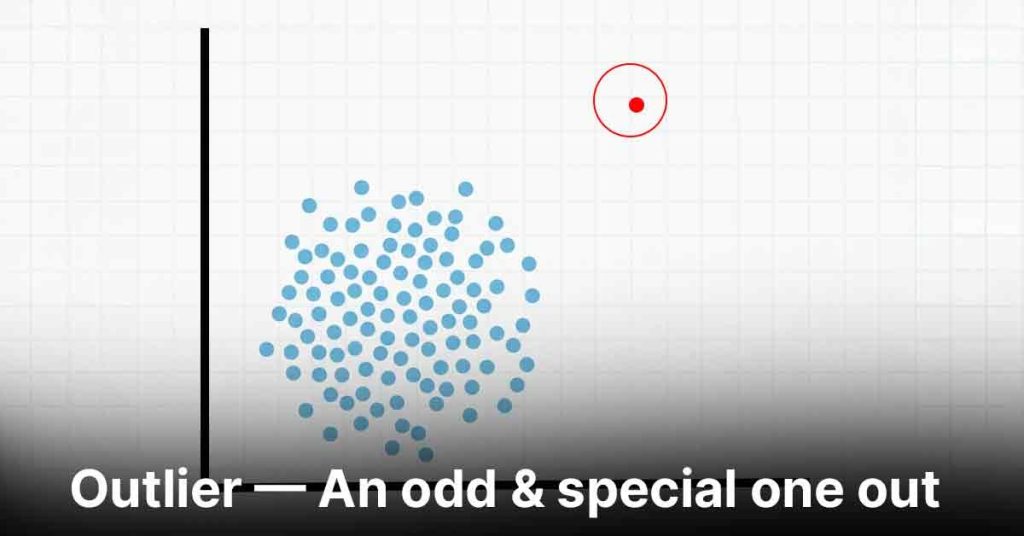
Outlier — An odd & special one out

“An extreme values that stand out greatly from overall pattern of values” Press enter or click to view image in full size It is interesting to see the translations of “outlier” — according to its context — in English: Atypical Featured Exceptional Abnormal Extreme Value, Abnormal Value, Aberrant Value! That gives us an idea, doesn’t it? According to

Outlier — An odd & special one out Read More »

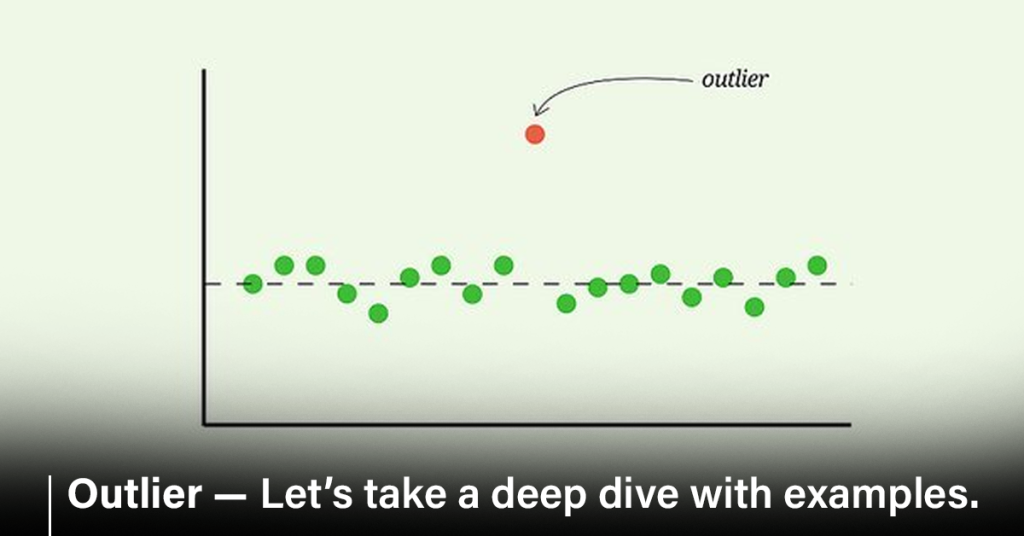
Outlier — Let’s take a deep dive with examples.

Let’s Brush up quickly what we have learnt so far:- I highly recommend to read the previous blog befor you dive in. Outlier — An odd & special one out An outlier can be defined as a data point that deviates significantly from the normal pattern or behavior of the data. Outliers Scenario — 1 Let’s see

Outlier — Let’s take a deep dive with examples. Read More »

Mean — The Average, my best guess of all time !!

“A number around which a whole data is spread out or the expected value in mathematics.”   What is Mean? The mean is a way to find the average of a set of numbers. How to Calculate Mean Add Up All the Numbers: First, you add together all the numbers in the set. Divide by How Many Numbers There

Mean — The Average, my best guess of all time !! Read More »

The Idea of Statistical Inference: Making Sense of Numbers.

The complete game of Stats is to make a guess on Sample and make Predictions or Inferences about Population.   Population & Sample Its all about choosing the unbiased or best sample or small slice or chunk from population which best describes or the best representative of my whole population. Population : The Population is the Entire group that we

The Idea of Statistical Inference: Making Sense of Numbers. Read More »

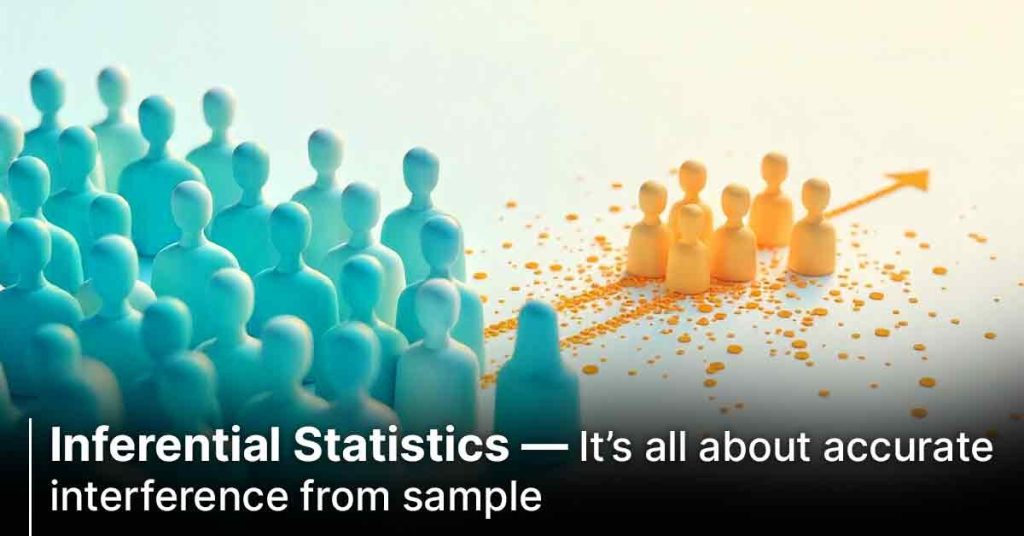
Inferential Statistics — It’s all about accurate interference from sample.

Let’s draw inferences about the population data from sample data. Press enter or click to view image in full size Introduction: Many a times, we can only afford to collect data from samples, because it is too difficult or expensive to acquire data from the whole population that we are interested in. While using descriptive

Inferential Statistics — It’s all about accurate interference from sample. Read More »

Statistics — Its all about reliability !!

A branch of mathematics concerns data collection, analysis, and interpretation. In its broadest sense, statistics is the science of analyzing data, which refers to a collection of tools and methods for evaluating, interpreting, displaying, and making decisions based on data. I found this little boring definition because 😁 But If I would say:- When you think about Statistics, what is your first thought? You may think

Statistics — Its all about reliability !! Read More »

Descriptive Statistics — What happened in the past !!

Let’s summarize or describe the historical data to understand what has happened in the past.   Descriptive Statistics   Descriptive statistics involves summarising and organizing the data so they can be easily understood. We typically describe the data in a sample. Descriptive analytics is often the first step in the data analysis process, providing a foundation for further

Descriptive Statistics — What happened in the past !! Read More »

    Register for Free Demo Here ... !!!